Instantaneous Current–Time (I–t) Analysis: The Missing Link Between Polarization Dynamics and Switching in Ferroelectric Materials
When students first enter the field of ferroelectric materials, the polarization–electric field (P–E) loop is usually the first and most familiar graph they encounter. It is commonly presented as the primary proof of ferroelectricity, and many young researchers assume that if the P–E loop is obtained, the job is complete. I also went through this phase during my research journey. I often found I–t curves included in highly reputable journals, and although I saw them repeatedly, I could not initially understand why they were so important. The logic behind this analysis was not immediately obvious, and for a long time, I accepted the I–t graph as just another supplementary figure.
It took me almost two years of continuous reading, experiments, and discussions to fully realize why journals emphasize the current–time graph and why it is considered essential evidence in ferroelectric characterization. Once this understanding became clear, I also realized that many students face the same confusion. The P–E loop shows the final hysteresis behavior, but the I–t graph reveals the underlying switching mechanism that cannot be seen through the P–E loop alone.
This article explains in a simple, student-friendly manner why the I–t graph is important, what it reveals about ferroelectric switching, and how it strengthens the scientific validity of your research.
What is a Current vs Time (I–t) Graph?
A Current vs Time (I–t) graph is a plot that shows how the electrical current flowing through the ferroelectric material changes with time when an external voltage pulse is applied. This current response observed is the direct effect of the polarization switching phenomena occurring in the ferroelectric material. While the P–E loop provides a static picture of the polarization, it does not show how the switching happens in real time. That hidden dynamic behavior becomes clearly visible when we plot current as a function of time.
In ferroelectric characterization, the material is exposed to a precisely designed voltage waveform—typically a triangular pulse or a PUND (Positive-Up Negative-Down) square pulse. As this voltage changes with time, the electric field inside the material also varies. The ferroelectric dipoles attempt to reorient themselves in response to this changing field. When many dipoles switch simultaneously, a rapid flow of charge is generated. This sudden charge movement appears as a distinct peak in the current–time (I–t) graph, serving as a clear signature of polarization switching within the material.
Mathematically, the relationship between current and polarization is expressed as:
This means the current is directly proportional to the rate of change of polarization with respect to time.
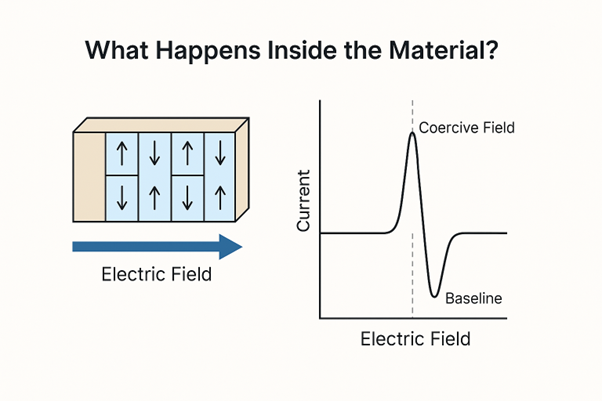
What Happens Inside the Material?
At low electric fields, the ferroelectric domains remain mostly stable, and any domain movement is slow or negligible. As the applied field gradually increases and approaches the coercive field, the situation changes rapidly. The domain walls begin to move almost suddenly, and a large number of domains switch their orientation within a very short time. This swift reorganization displaces a significant amount of charge, and the measurement system detects this as a sharp spike or peak in the current signal.
Once the domains have completed their switching and the polarization becomes stable again, the current quickly settles back to a small baseline value. This baseline typically represents the material’s leakage current or its capacitive response and indicates that no further switching is taking place.
How Does an I–t Graph Look?
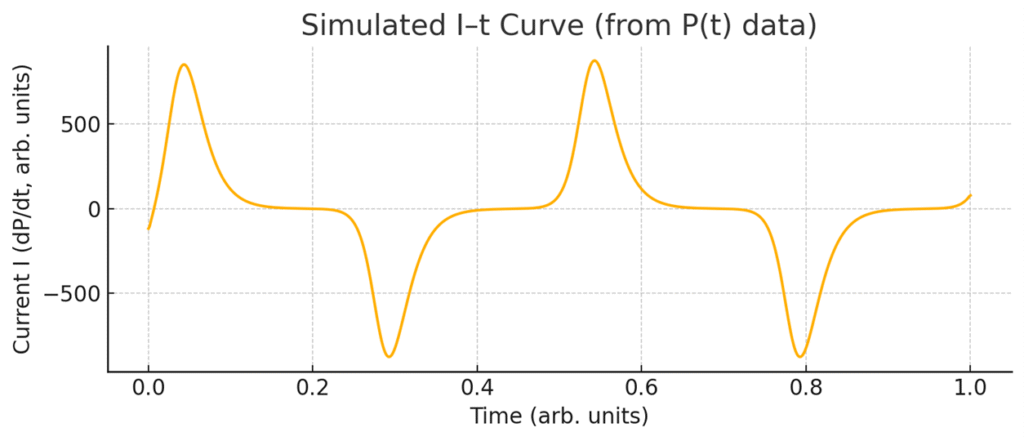
A Current–Time (I–t) graph for a ferroelectric material has a very distinct and informative shape. It typically displays:
- Two switching peaks — one during the positive half-cycle of the electric field and another during the negative half-cycle
- A steady baseline current that represents leakage or capacitive response of the material
- Possible time shifts or slight asymmetry, depending on sample quality, defects, or measurement conditions
Because of these features, the I–t graph becomes a powerful tool for understanding ferroelectric switching with clarity and precision.
Understanding the Shape of the I–t Curve
A typical I–t plot contains two sharp current spikes, one positive and one negative, appearing at different times during the full voltage waveform applied to the sample. Here’s how to interpret them step by step:
- First Sharp Peak – Positive Switching
When the applied electric field increases and reaches the positive coercive field, a large number of ferroelectric domains switch their orientation almost simultaneously. This results in a sharp upward spike on the I–t graph.
Meaning:
The polarization has switched from a negative (or random) state to a positive state.
- Returning to Baseline
Once the switching event is complete, the current falls back to the baseline level. This indicates that no further domain switching is occurring at that moment—the only remaining current is leakage or capacitive current.
- Second Sharp Peak – Negative Switching
As the electric field reverses direction and reaches the negative coercive field, the domains switch back. This produces a sharp downward spike, typically similar in magnitude to the first peak but opposite in direction.
In an ideal system, this peak appears as a mirror image of the positive switching peak but positioned below the baseline.
Meaning:
Polarization has switched from the positive direction back to a negative orientation.
Peak Width:
The width of a switching peak carries important information about how the ferroelectric domains are responding to the applied electric field over time. A narrow peak means that the domains switch very quickly and almost simultaneously. This rapid, collective switching is generally observed in high-quality ferroelectric materials with fewer defects and well-aligned dipoles.
On the other hand, when the peak appears broad, it tells a different story. A broad peak indicates that the switching is happening more slowly and over a longer period of time. Instead of all domains switching together, different regions of the material respond at slightly different times. This usually occurs when the material contains defects, trapped charges, impurities, or pinning centers that make it difficult for some domains to move freely. Broadening can also result from factors such as lower crystallinity, variations in film thickness, grain size or processing issues that create non-uniform internal fields.
Such broad or distorted peaks are often observed in doped or defect-engineered ferroelectrics. In these materials, the switching process is intentionally modified or slowed down to achieve specific electrical characteristics. Therefore, the shape of the peak becomes an important indicator of both the intrinsic material quality and the engineered properties of the sample.
In essence, the peak width acts like a window into the material’s internal landscape. A narrow peak reflects fast, clean switching, while a broad peak highlights delays, obstacles, and variations within the material. By simply examining how wide or narrow the peak is, researchers can gain immediate insight into the structural quality and switching dynamics of the ferroelectric sample.
Peak Symmetry:
In an ideal ferroelectric response, the two switching peaks in the I–t graph should appear almost perfectly symmetric. This means they have similar height, similar shape, and appear at equal but opposite positions in time. When such symmetry is observed, it tells us that the material is switching smoothly in both directions of the electric field. The domains experience equal ease while switching from negative to positive and from positive to negative. This symmetry also indicates that the material has very little internal bias and that built-in electric fields are negligible. In other words, symmetric peaks reflect a healthy, well-balanced ferroelectric state.
However, in many practical cases, the peaks become asymmetric. One peak may be taller or shorter, broader or narrower, or may shift slightly in time compared to the other. This asymmetry reveals that the switching process is not balanced. The domains might be switching more easily in one direction than the other. Such behavior can arise due to several reasons—imprint caused by prolonged poling, fatigue from repeated cycling, aging effects, or the presence of built-in polarization fields. Asymmetric peaks are especially common in thin films and doped ferroelectrics, where defects, strain, and interface effects strongly influence domain motion.
Thus, by simply examining whether the peaks are symmetric or asymmetric, researchers gain valuable insight into the internal condition of the material. Symmetry points toward stable and uniform switching, whereas asymmetry serves as a diagnostic clue that the material is experiencing internal stresses, aging, or directional bias during polarization switching.
Peak Height (Amplitude):
The height of each switching peak in the I–t graph directly reflects how much polarization is being reversed at that moment. When the peak is tall and sharp, it indicates that a large amount of charge is flowing in a very short time. This means many ferroelectric domains are switching actively and collectively, demonstrating strong polarization switching and good ferroelectric behavior. In well-prepared samples, such prominent peaks confirm that the material is responding energetically to the applied electric field.
If the peaks appear smaller than expected, it suggests that fewer domains are participating in the switching process. This reduction in peak height can occur for several reasons. The most common is fatigue, where repeated electrical cycling gradually weakens the material’s switching ability. Smaller peaks may also indicate partial switching, where only a portion of the domains reorient due to structural defects, internal bias, or insufficient field strength. In some cases, high leakage current can overshadow the true switching signal, making the switching peaks appear suppressed even though the domains are attempting to switch underneath.
In this way, the amplitude of the switching peaks serves as a clear indicator of the material’s switching strength, domain activity, and overall ferroelectric health. A tall peak signals robust switching, while a reduced peak height warns researchers about degradation, leakage, or incomplete domain motion.
Effects of Leakage Current
In some measurements, the baseline of the I–t graph does not remain flat. Instead, it may rise gradually, fluctuate, or display noticeable noise. Such behavior indicates that an additional conduction pathway is present in the material, meaning the current being measured is not purely due to ferroelectric switching. A sloping or rising baseline typically points to high leakage current, which can interfere with the true switching response. When the signal appears noisy, it often suggests issues such as measurement instability, poor electrical contacts, or external environmental disturbances. In more severe cases, the leakage current may become so dominant that the switching peaks appear weak or are almost completely buried within the baseline. This makes it difficult to identify the actual ferroelectric behavior and suggests that the switching current is being masked by unwanted conduction.
When Switching Peaks Are Missing
In some experiments, the expected switching peaks may not appear at all, or they may be extremely small. This usually indicates that the material is not exhibiting strong ferroelectric switching. The sample might be non-ferroelectric, or it may have undergone significant fatigue or degradation, reducing its ability to switch. In other cases, excessive leakage current can dominate the signal and hide the switching response entirely. Sometimes the applied voltage is simply too low and does not reach the coercive field, so the domains never switch and no peak is generated.
When switching peaks are absent or unclear, it becomes important to repeat the measurement using a PUND sequence, which helps separate true switching current from leakage and provides a clearer understanding of the material’s behavior.
Why the P–E Loop Alone Can Be Misleading
Although the P–E hysteresis loop is widely used to evaluate ferroelectric behavior, it does not always tell the full story. Many materials—especially those with high leakage, strong dielectric non-linearity, charge trapping, or electrode-related artefacts—can produce loops that look ferroelectric even when no true ferroelectric switching is taking place. These effects can distort the loop and create shapes that resemble genuine hysteresis, leading to incorrect conclusions.
This is where the I–t graph becomes extremely valuable. True ferroelectric switching always generates sharp, well-defined current peaks at the moments when the polarization reverses. If these peaks are absent, weak, or irregular, it signals that the material may not be undergoing real ferroelectric switching. Simply observing the presence or absence of these peaks helps researchers distinguish authentic ferroelectric behavior from misleading artefacts that mimic it. The I–t graph offers a real-time view of the switching process. Every time the polarization flips, a distinct current spike appears, providing direct evidence of domain activity—information that the P–E loop cannot reveal on its own. This becomes especially important when studying thin films, leaky ceramics, or defect-rich materials where the P–E loop may appear distorted, incomplete, or unreliable.
A clear and well-defined I–t graph not only confirms the presence of switching but also shows how fast the domains move, whether the switching is symmetric, and how stable the response remains over repeated cycles. These insights are crucial when developing materials for high-performance memory devices, sensors, actuators, and other ferroelectric-based technologies.
Conclusion
The current–time (I–t) graph is a crucial tool in ferroelectric characterization. It not only supports and validates the P–E loop but also uncovers the real dynamics behind polarization switching. By highlighting switching peaks, revealing measurement artefacts, and confirming the reliability of remanent polarization values, the I–t graph provides insights that no other measurement can fully capture. Understanding how to interpret this graph may take time and practice—something I experienced firsthand during my own research journey—but once its significance becomes clear, it fundamentally changes the way we analyze and understand ferroelectric materials.
As research standards continue to evolve, journals now expect authors to provide clear evidence of dynamic polarization switching rather than relying solely on a static P–E loop. Leading journals—including Applied Physics Letters (APL), Journal of Applied Physics (JAP), Ferroelectrics, and Sensors & Actuators—routinely require I–t curves to support ferroelectric claims. Including these curves not only adds transparency to your work but also strengthens the overall credibility of your results and significantly improves your chances of acceptance.