From Confusion to Clarity: How to Distinguish Perovskite Crystal Structures — Rhombohedral, Pseudocubic, and Cubic — in X-Ray Diffraction Patterns
When we analyze crystal structures using X-ray Diffraction (XRD), each set of crystal planes produces a characteristic diffraction peak. These peaks depend on how atoms are arranged inside the crystal. If the symmetry or shape of the crystal unit cell changes, the position and number of diffraction peaks also change. This helps researchers identify phase transitions in materials, especially in ferroelectric and piezoelectric systems.
However, students commonly face confusion while interpreting the diffraction patterns of ferroelectric materials especially while identifying perovskite’s rhombohedral, pseudocubic, and cubic crystal structures. This is because, at first glance, their diffraction peaks look very similar, and without proper understanding, it becomes difficult to say which structure is actually present. Accurately determining the crystal structure is crucial for understanding material properties, as even slight structural distortions can lead to significant changes in behaviour. This makes it essential for researchers and students to carefully distinguish between cubic, rhombohedral, pseudocubic, and other structural phases when analyzing materials.
This blog will help you clear that confusion by explaining the main differences between them and giving you practical tips to identify the right crystal structure.
Table of Contents
Why Students Find It Difficult to Segregate These Structures?
Students often face difficulty because the X-ray diffraction patterns of perovskite-based materials look very similar at first glance. The basic perovskite framework (ABO₃) can distort slightly into cubic, rhombohedral, tetragonal, orthorhombic, or pseudocubic forms — and these distortions do not always produce big, obvious changes in the diffraction peaks. Instead, the differences appear as very small peak splitting, shoulder peaks, or shifts in lattice parameters, which can be hard to notice without experience.
Another reason is instrumental limitations. Low-resolution XRD machines may not clearly show the subtle splitting of peaks like (111), (200), or (220), so students often assume the structure is cubic or pseudocubic when it may actually be rhombohedral. Similarly, peak broadening due to nanosized effects or strain can mask true splitting, adding to the confusion.
The conceptual overlap between pseudocubic and cubic also causes problems. A pseudocubic phase looks almost cubic in X-ray diffraction, but careful refinement shows small distortions. Without running Rietveld refinement, students easily mistake one for the other. Further, many students focus only on visual inspection of peaks rather than combining X-ray diffraction with lattice parameter refinement, profile fitting, or complementary techniques like Raman spectroscopy. As a result, they miss the hidden structural details and remain confused about whether their material is cubic, pseudocubic, or rhombohedral.
What Happens in a Cubic Crystal?

In a perfectly cubic structure, the spacing between crystal planes is equal in all directions.
Therefore, a particular plane like (111) or (200) produces only one diffraction peak, because all equivalent atomic planes are symmetrical.
So in cubic structure:
(111) → one single diffraction peak
(200) → one single diffraction peak
What Happens When the Structure Distorts?
When the material undergoes a phase transformation due to changes in composition, temperature, or applied electric field, the unit cell can distort and loses its ideal cubic symmetry. This structural distortion modifies the spacing between atomic planes, altering the diffraction condition.
As a result, the XRD peak that originally appeared as a single reflection begins to divide into two distinct peaks—a phenomenon known as peak splitting, which serves as a strong evidence of the phase transition.
Let us examine each phase individually to understand how its structural behavior is reflected in the XRD pattern.
Peak Splitting from Cubic (111) to Rhombohedral ( Pseudocubic) (111) and (-111)
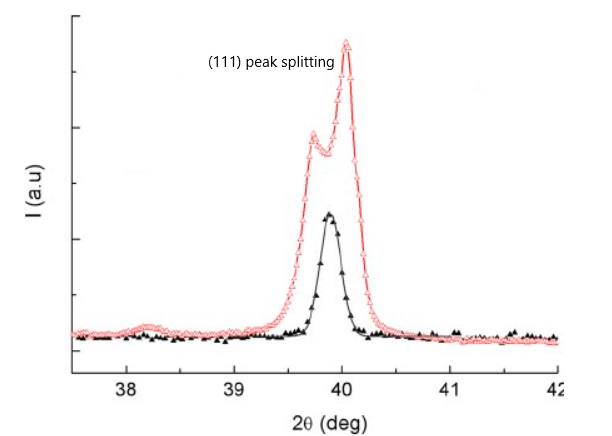
During the transition from cubic structure to a rhombohedral (pseudocubic) phase, the (111) diffraction peak splits into two slightly separated peaks:
- (111)
- (–111) (also written as (1̅11))
This indicates that the unit cell angles are no longer exactly 90°, thereby, breaking cubic symmetry.
Is Rhombohedral the Same as Pseudocubic Phase?
No — rhombohedral and pseudocubic are not exactly the same, but in many ferroelectric perovskites (such as PZT, PMN-PT, BNT-BT), the rhombohedral phase is often described as pseudocubic because its structure is very close to cubic, and XRD patterns appear almost like cubic with only slight distortions.
A cubic structure has perfect symmetry:
a =b=c and α = β = γ = 90°
When the symmetry reduces slightly during phase transition, the structure may become rhombohedral:
a= b= c but α = β = γ ≠ 90°
This means that although bond angles change, the shape is still almost like a cube, so the lattice parameters look similar to cubic.
Because of this reason, researchers often call the rhombohedral phase pseudocubic, meaning:
“Nearly cubic, but not exactly cubic.”
In cases where the XRD peak remains unsplit yet displays noticeable asymmetry or peak broadening, the phase is typically referred to as pseudocubic.
When do we use the term pseudocubic?
We use pseudocubic indexing when:
- The distortion from cubic is very small.
- XRD peaks remain close to cubic peak positions.
- Splitting is visible but not very strong.
Peak Splitting from Cubic (200) to Tetragonal (002) and (200)

In a cubic crystal structure, the lattice parameters are equal along all three axes:
a =b=c
Because of this perfect symmetry, the spacing between planes such as (200) is the same in every direction. Therefore, when we record an X-ray diffraction (XRD) pattern for a cubic phase, we observe only one single diffraction peak near the (200) reflection position. However, when the crystal undergoes a phase transition from cubic to tetragonal, the symmetry is reduced.
In a tetragonal unit cell, the lattice parameters become:
a = b ≠ c
This means that the spacing between planes perpendicular to the c-axis becomes different from the spacing perpendicular to the a- and b-axes. As a result:
- The original cubic (200) peak no longer represents one uniform spacing.
- Instead, it separates into two distinct peaks:
- (200) → planes perpendicular to the a/b-axis
- (002) → planes perpendicular to the c-axis
Since the interplanar spacing is different from , they produce two different diffraction peak positions.
The splitting of the cubic (200) reflection into (002) and (200) peaks is direct evidence of a tetragonal phase, caused by unequal lattice parameters along the c-axis compared to the a- and b-axes.
Quick Analysis
The perovskite structure, with a general formula of ABO₃, is one of the most important crystal families in materials science. It consists of larger A-site cations and smaller B-site cations inside oxygen octahedra. Depending on temperature and ionic size, perovskites can appear cubic, tetragonal, rhombohedral, or even orthorhombic. In X-ray diffraction patterns, perovskites usually look cubic, but if you observe carefully, you may notice small peak splitting such as (200) dividing into (200) and (002), which is a sign of distortion.
A rhombohedral structure is basically a distorted cubic form where the angles are slightly shifted from 90°. This type of distortion is commonly found in ferroelectrics like Bi₀.₅Na₀.₅TiO₃ (BNT) or Pb(Zr,Ti)O₃ (PZT) at certain compositions. In XRD, the rhombohedral phase can be recognized by the splitting of reflections such as (111) and (200). These splittings are usually very small and require high-resolution XRD or Rietveld refinement to confirm.
A pseudocubic structure is trickier. It looks cubic in the X-ray diffraction pattern because the distortions are so small that the peaks do not split visibly. Many solid solutions near the morphotropic phase boundary (MPB) show pseudocubic behaviour. In a true cubic structure, the main peaks such as (111), (200), and (220) are sharp and perfectly single. In a pseudocubic phase, these peaks also appear as single reflections, but careful analysis shows that they are only “nearly cubic.” This happens because small distortions in the lattice, such as tiny deviations in lattice parameters or angles, are not large enough to cause clear peak splitting. To properly identify pseudocubic structures, it is recommended always to refine the lattice parameters (such as Rietveld analysis) before making a conclusion to check if the cell parameters are truly equal or only nearly equal. This step will help you correctly identify a pseudocubic phase and avoid misinterpretation.
Although the peaks appear single and sharp, if we refine the lattice parameters carefully, we will find that the structure is not truly cubic. This is one of the most common sources of confusion for students, as pseudocubic is often mistaken for cubic.
The cubic structure, on the other hand, is the most symmetrical and perfect one. Its cell dimensions are equal, with right-angled geometry, meaning the unit cell exhibits identical lattice parameters with orthogonal (90°) interaxial angles. In X-ray diffraction pattern, cubic structures are easy to recognize because the peaks such as (200), (220), and (222) remain single and unsplit. True cubic phases are usually stable at higher temperatures, like BaTiO₃ above its Curie point.
Once these differences become clear, interpreting X-ray diffraction patterns becomes far more straightforward and dependable. With careful analysis and thoughtful observation, it is possible to move from confusion to clarity and accurately determine the true crystal structure of the material.
How Small Structural Changes Affect Material Properties?
Crystal structure determines how atoms are arranged, how bonds are oriented, and how electrons, phonons, and dipoles behave inside a material. Even a tiny distortion in lattice parameters or bond angles can lead to large differences in physical and functional properties. For example:
- Ferroelectric and Dielectric Properties:
In perovskites like BaTiO₃ or Pb(Zr,Ti)O₃, a shift from cubic (non-polar) to tetragonal or rhombohedral (polar) phases makes the material ferroelectric. That means a small tilt of TiO₆ octahedra allows the material to hold an electric polarization.
- Piezoelectric Response:
At morphotropic phase boundaries (MPB), where cubic, tetragonal, and rhombohedral phases coexist, materials show extremely high piezoelectric coefficients. Even a small structural change can increase sensitivity and efficiency in sensors, actuators, and energy harvesters.
- Optical Properties:
In perovskite solar cells, a slight distortion in the lattice changes the bandgap, affecting how much sunlight is absorbed. This can decide whether a material is suitable for high-efficiency photovoltaics or not.
- Magnetic Properties:
In some perovskite oxides (like manganites), slight distortions in Mn–O–Mn bond angles alter electron hopping, directly affecting magnetoresistance and conductivity.
- Mechanical and Thermal Stability:
Phase transitions between cubic, rhombohedral, or tetragonal structures often come with volume changes, which affect thermal expansion, hardness, and stress tolerance
Conclusion and Key Insights
Accurate interpretation of X-ray diffraction patterns in perovskite ferroelectric materials requires a clear distinction among the rhombohedral, pseudocubic, and tetragonal phases. By carefully examining peak shape, symmetry, and the presence or absence of splitting near the (200)/ (111) reflection, researchers can reliably determine the underlying crystal structure. In practice, cubic phases show a single symmetric peak, pseudocubic phases exhibit slight broadening or asymmetry, and tetragonal phases demonstrate distinct splitting into the (002) and (200) reflections. Recognizing these characteristic signatures transforms XRD analysis from a confusing task into a precise and powerful diagnostic tool.
If you found this explanation helpful and want more research-oriented guides on XRD interpretation, ferroelectric materials, and nanomaterials characterization, stay connected with AdvanceMaterialsLab.com. Leave a comment below with your questions or topics you would like to learn next—your feedback helps shape future tutorials that support students and researchers worldwide.
Quick Comparison Table: XRD Signatures of Different Structures
| Structure | Key XRD Feature | Notes for Students |
|---|---|---|
| Cubic | Peaks such as (200), (220), (222) remain single and unsplit | Perfect symmetry; usually stable at higher temperatures (e.g., BaTiO₃ above Curie temperature). |
| Pseudocubic | Peaks look single (no visible splitting), but careful refinement reveals slight distortion | Often confused with cubic; common near morphotropic phase boundaries (MPB). Perform lattice-parameter refinements. |
| Rhombohedral | Subtle splitting of reflections such as (111) and (200) | Requires high-resolution XRD or Rietveld refinement to confirm; common in many ferroelectrics. |
| Perovskite (ABO₃) | Parent matrix that can show cubic, tetragonal, rhombohedral, or orthorhombic signatures | Always check for distortions; perovskite is a family name (ABO₃) rather than a single symmetry. |
Tip: If you see peak broadening, check crystallite size and strain effects before concluding symmetry changes. Use Rietveld refinement and complementary techniques where possible.
Tips for Students: Quick Checklist
- Index main peaks: Carefully assign peak indices and compare with standard perovskite positions.
- Look for splitting: Check (111), (200), and (220) reflections for subtle splitting that signals distortion.
- Run Rietveld refinement: Test multiple structural models (cubic, rhombohedral, tetragonal) and refine lattice parameters.
- Compare goodness of fit: Use χ² and Rwp values to choose the best-fitting model.
- Cross-check results: Verify findings with complementary methods like Raman, TEM, or dielectric measurements.
- Beware of broadening: Distinguish true splitting from peak broadening caused by size, strain, or instrument effects.
Tip: If peaks look cubic but you suspect distortion, always refine lattice parameters before concluding it is cubic.
References
- “X-Ray Diffraction Techniques for Mineral Characterization” — A. Ali, et al., Minerals. MDPI
- “Review of X-Ray Crystallography” — D. R. Powell, Journal of Chemical Education (ACS). ACS Publications
- “Ten Crystallography Articles that We Think Must Be Read” — C. Massera, et al., PMC (2023). PMC
- “A Review of Pharmaceutical Powder Crystallography” — J. A. Kaduk, MRA (2025). Society of Medicine
- “The Nobel Science: One Hundred Years of Crystallography” — J. C. Brooks-Bartlett. Taylor & Francis Online
- “X-ray crystallography” — M. S. Smyth, PMC (2000). PMC
- Rietveld refinement” (Wikipedia entry). Wikipedia

Dr. Rolly Verma
Continue your readings with these student-friendly tutorial notes on AdvanceMaterialsLab.com
For readers interested in high-temperature superconductors and their role in next-generation energy and transportation systems, you can explore our detailed guide on yttrium barium copper oxide (YBCO): 🔗 YBCO Superconductor — Properties & Applications
If you want to understand how nanoceramics enhance mechanical, thermal, and electronic performance in modern devices, you may find this article helpful:🔗 Nanoceramics — Properties & Advancements
Readers exploring smart materials and memory applications may also benefit from our step-by-step tutorial on ferroelectrics, including working principles and research trends:
🔗 Ferroelectrics — Tutorials & Research Guides
If you notice any inaccuracies or have constructive suggestions to improve the content, I welcome your feedback. It helps maintain the quality and clarity of these educational resources.