Is What You’re Seeing in the Hysteresis Loop Truly Due to Ferroelectricity — or Just an Illusion?

“Unlocking the Truth Behind Polarization Measurements in Ferroelectric Materials”
The journey of investigations for any new scholar stepping into the field of ferroelectrics, typically begins with measuring the polarization-electric field (P-E) hysteresis loop. The P-E hysteresis loop is the classic signature of ferroelectric materials. This fundamental test serves as the first indicator of a material’s ability to exhibit switchable polarization under an external electric field providing the quick visual confirmation of ferroelectric-like behavior, such as the characteristic loop shape, coercive field (Ec) and the remnant polarization (Pr) – a diagnostic fingerprint of ferroelectricity. A beautifully shaped hysteresis loop with broad symmetricity and saturation at first glance, might seems like undeniable proof of ferroelectricity and brings a smile to the face of any researcher. But what if, the ferroelectric signal appearance is just a cleverly disguised illusion! Similar-looking loops can also arise from non-ferroelectric origins such as leakage current, ionic migration, charge defects, interfacial charges, or charge trappings. These artefacts can mislead the true switching polarization values and sometimes may provide falsely attributes of ferroelectric behavior to non-ferroelectric systems.
In this blog, we will explore the hidden factors that can distort ferroelectric hysteresis loops, leading to misinterpretation of results. From leakage currents to capacitive effects, we’ll uncover what might be creating an illusion of ferroelectricity. To truly interpret what the P-E loop reveals, it is essential to first understand the fundamental concept and the physical mechanisms that makes a material ferroelectric.
Table of Contents
What Defines True Ferroelectric Behavior?
A material is ferroelectric when it exhibits a switchable spontaneous polarization — which means even in the absence of an external electric field, the material shows a built-in polarization or we can say naturally occurring electric dipole moment. Also, this spontaneous polarization is switchable, meaning its internal electric dipoles can be reversed with an external electric field, and this polarization remains even after the field is removed. If the graph is plotted between the polarization and the applied field with this switch ability, it shows the characteristic hysteresis loop. This switching is characterized by a well-defined Coercive Field (Ec), Remnant Polarization (Pr), Stability across frequency and temperature, Structural phase transitions confirming domain reorientation. The P-E hysteresis loop in classical ferroelectrics like BaTiO₃ and PZT (lead zirconate titanate) is primarily due to intrinsic dipole domain switching and is supported by structural or spectroscopic evidences such as X-Ray Diffraction, Raman Spectroscopy, Piezo Force Microscopy etc.
Diagnosing Artifacts in Ferroelectric Hysteresis Loops
Common pitfalls such as leakage currents, capacitive charging, and electrode interface effects can distort the loop, misleading the characteristic ferroelectric hysteresis loop. If we rely solely on a conventional P-E loop without deeper analysis, we risk mistaking non-switching phenomena for true ferroelectricity. Let’s discuss those common pitfalls one by one.
Leakage Current
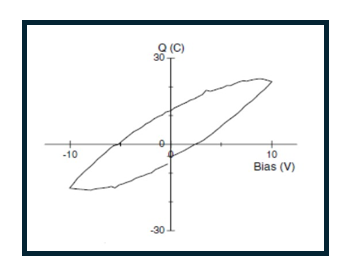
Studying ferroelectric-like behavior in leaky dielectrics is tricky, because experimental errors can easily hide or mimic the true ferroelectric response. Hence, this is one of the most common artifacts that mislead the interpretation of ferroelectric polarization–electric field (P–E) hysteresis loops. Scott in his article “Ferroelectrics go bananas (2007)” highlighted how lossy dielectrics (fig-1), including even household objects like bananas, can produce hysteresis loops that mimic ferroelectric behavior due to leakage currents.
In leaky dielectrics, the current flowing through the material is not due to domain switching but due to charge conduction. This can distort the loop, making it wider or more tilted — often mistaken for high remnant polarization (Pr). In a recent article by Silva et al. (2025), the emergence of ferroelectric-like hysteresis in leaky dielectrics has been investigated. They explained the microscopic model of nonequilibrium carrier generation in a leaky dielectric and the hysteresis loops for the dielectric response of non-polar, non-ferroelectric materials. By differentiating true ferroelectric behavior from effects induced by non-equilibrium dipoles and energy-dependent transfer rates, the model provides a theoretical foundation for experimental observations and informs the accurate characterization of materials used in capacitors, transistors, and memory devices. According to this model these artifacts often arise from the defects like oxygen vacancies, charge defects, interstitial atoms, grain boundaries and material interfaces. These defects significantly influence leakage currents by hosting high densities of charge-trapping states giving rise to the formation of the non-linear dielectric response. Vasudevan et al. (2017) highlighted hysteresis loops and remnant polarization states in non-ferroelectric materials, often misinterpreted as evidence of true ferroelectricity with the help of piezoresponse force microscopy (PFM).
Effects of Leakage on the Hysteresis Loop (Recap…)
Loop Asymmetry
Instead of the characteristic rectangular “square” loop, the hysteresis curve may become tilted or oval-shaped. This is because leakage adds a linear or resistive component to the current, making the polarization signal look smeared. Leakage can introduce asymmetry between the positive and negative branches of the loop, especially if it is dependent on field polarity (e.g., due to Schottky barriers).
Overestimation of Polarization (Pr/Ps)
If leakage is high, the measured current includes both the polarization switching current and the conduction current (leakage). This can cause an artificial increase in the calculated remanent polarization, making it seem like the material is more ferroelectric than it actually is.
Shift in the Coercive Field (Ec)
Excessive leakage can cause the coercive field (Ec) to be ill-defined or shifted, as the switching behavior gets masked by the conduction path.
Non-saturating Loops
The loop may not close properly or show a saturation behavior even at high fields, indicating that what’s being observed is not true ferroelectric switching, but a mix of other effects like Joule heating or dielectric breakdown or any kind of charge defects.
Capacitive Charging Effects
Capacitive charging effects is a type of Interfacial charges/space charges or the accumulation of charges at the surface of the system. This kind of charge accumulation can create an internal bias field that opposes the applied external field, effectively reducing the effective field acting on the ferroelectric domains. Okatan et al. (2009) in his article in Acta Materialia simplified how asymmetrically distributed space charges results in a slimmer P-E hysteresis loop, characterized by a smaller remanent polarization (Pr) and a larger saturation polarization (Ps), and potentially a higher coercive field (Ec) in the monolithic stress-free barium strontium titanate (BST) ferroelectrics. These effects stem from the displacement current or the space charges induced by the charging and discharging cycles of the sample under an applied electric field. This is a non-switching current which produces elliptical or slim P–E loops that may mislead the true ferroelectric behavior. The capacitive charging effect, combined with other phenomena like ion migration, can lead to symmetric or asymmetric hysteresis loops [ref. 8,9].
Electrode Interface Effects
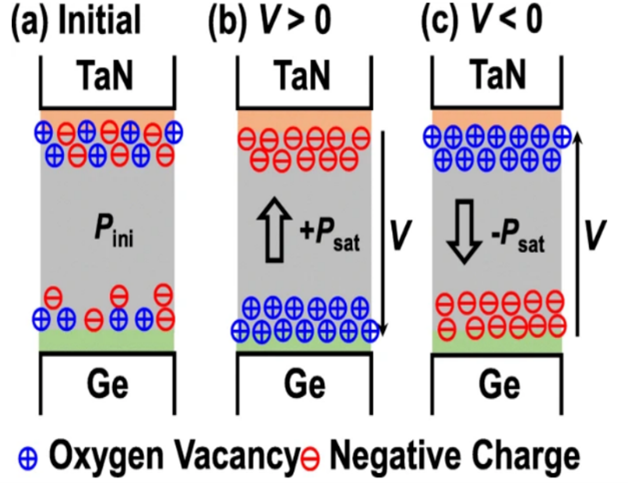
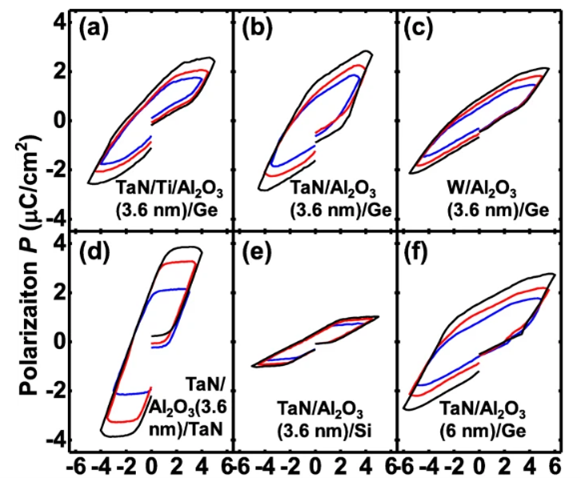
Zubko et al. (2006) mentioned that the intuitive vision of ferroelectric phenomenon is often deceptive in the area of nanoscale materials such as thin films. The space-charge accumulation and the interfacial trapped charges in oxide thin films are the common artefacts which produces ferroelectric loop-like behavior, especially under low-frequency measurements. Peng et al. in his article in Nanoscale Research Letters (2020) clarified the origination of ferroelectric-like behavior in amorphous Al2O3 due to the formation of oxygen vacancy dipoles. The author measured Polarization vs. Voltage characteristics of the 3.6-nm-thick amorphous Al2O3 film capacitors with different electrodes as shown in fig-3. The ferroelectric-like behavior is strongly correlated with interfaces, and it is proposed that the formation of oxides between the electrodes and Al2O3 film produces more oxygen vacancies contributing to a ferroelectric-like behavior. It is important to note here that Al₂O₃ is amorphous and lacks the intrinsic dipoles necessary for switchable polarization, as seen in classic ferroelectrics. In this case, the observed ferroelectric-like behavior arises from dipoles formed by the segregation of voltage-modulated oxygen vacancies and negative charges within the system, a phenomenon that is highly dependent on the frequency and strength of the applied electric field and not an intrinsic ferroelectric character.
Measurement Conditions
Measurement condition is also one of the important factors sensitive to the accuracy of a ferroelectric P–E hysteresis loop. Factors such as measurement speed, compensation settings, and signal noise can easily lead to misinterpretation. Key parameters—including frequency, voltage amplitude, waveform shape, temperature, and integration time—all have a substantial impact on the loop’s appearance and the conclusions drawn from it. For example, at high frequencies, domain switching may be incomplete, resulting in a narrower loop and an underestimation of remanent polarization. On the other hand, very low-frequency measurements can allow leakage currents or charge injection to dominate, artificially boosting the measured polarization and distorting the loop. Inadequate voltage amplitude might not fully switch all domains, producing a partial loop, while applying excessive voltage can introduce non-ferroelectric effects or even trigger dielectric breakdown. The shape of the voltage waveform also matters—studies have shown that triangular or trapezoidal pulses result in different switching characteristics than sinusoidal waveforms due to variations in the duration of electric field application. Temperature further complicates interpretation; as the sample nears its Curie point, its ferroelectric properties weaken, leading to a thinner, more linear loop that may no longer reflect true ferroelectric behavior.
Additionally, non-ferroelectric contributions such as Resistive currents (Ohmic losses), Displacement (capacitive) currents, Dielectric charging effects…can misinterpret the loop and inflate polarization values, making the material seem better than it actually is.
So next time you see a beautiful P-E loop on your screen, ask yourself:
Is this really ferroelectric switching… or just an electrical illusion?
Final Thoughts — Why This Matters
Misinterpreting a leaky loop as ferroelectricity doesn’t just affect the academic claims, but can lead to wrong conclusions in device design, energy harvesting systems, or memory technologies. Conventional hysteresis loop measurements (like Sawyer-Tower method) cannot separate genuine ferroelectric switching current from leakage current. This leads to false positives, sometimes a non-ferroelectric material may appear ferroelectric, or the intrinsic properties of real ferroelectrics may be misjudged. In ferroelectric memory, energy storage capacitors, or nanoelectronics sensors, misidentifying materials can lead to poor device performance, irreproducible results, and incorrect conclusions. That’s where PUND (Positive-Up Negative-Down) measurements come into play — they help separate the switching from non-switching currents.
Research Tip for Beginners
Always analyse the I–V characteristics of your sample before interpreting the P–E loop. If the leakage current is high, consider using techniques such as PUND (Positive Up Negative Down) measurements or pulse-based methods to isolate the true switching polarization from the leakage component.
👉 Up next, we’ll explore how PUND analysis helps clarify whether the observed hysteresis is real or just an illusion. [Read: “How to Perform PUND Measurements — A Beginner’s Lab Manual” →]
References
- P. Zubko, G. Catalan, and A.K. Tagantsev, “Flexoelectric effect in solids,” Annu. Rev. Mater. Res., 43, 387–421 (2006).
- Peng, Yue, et al. “Ferroelectric-like behavior originating from oxygen vacancy dipoles in amorphous film for non-volatile memory.” Nanoscale Research Letters 15 (2020): 1-6.
- e Silva, Filgueira, et al. “Microscopic modeling of polarization dynamics in leaky dielectrics: Insights into ferroelectric-like behavior.” Materials Science and Engineering: B 316 (2025): 118089.
- Vasudevan, Rama K., et al. “Ferroelectric or non-ferroelectric: Why so many materials exhibit “ferroelectricity” on the nanoscale.” Applied Physics Reviews 4.2 (2017).
- Scott, J. F. “Ferroelectrics go bananas.” Journal of Physics: Condensed Matter 20.2 (2007): 021001.
- Lee, Daesu, et al. “Giant flexoelectric effect in ferroelectric epitaxial thin films.” Physical Review Letters 107.5 (2011): 057602.
- Okatan, M. B., J. V. Mantese, and S. P. Alpay. “Effect of space charge on the polarization hysteresis characteristics of monolithic and compositionally graded ferroelectrics.” Acta materialia 58.1 (2010): 39-48.
- Chen, Bo, et al. “Impact of capacitive effect and ion migration on the hysteretic behavior of perovskite solar cells.” The journal of physical chemistry letters 6.23 (2015): 4693-4700.
- Pintilie, L., et al. “The effect of the top electrode interface on the hysteretic behavior of epitaxial ferroelectric Pb (Zr, Ti) O3 thin films with bottom SrRuO3 electrode.” Journal of Applied Physics 112.6 (2012).
- Hall, D. A., M. Cain, and M. Stewart. “Ferroelectric hysteresis measurement & analysis.” Minutes of the NPL CAM7 IAG Meeting. 1998.
If you notice any inaccuracies or have constructive suggestions to improve the content, I welcome your feedback. It helps maintain the quality and clarity of this educational resource.
