How to Interpret Raman Spectra: Step-by-Step Guide for Materials Science Students (Beginner to Advanced)
A step-by-step systematic approach to reading Raman spectra, identifying functional groups, and assigning peaks with confidence. This tutorial will guide you through the fundamental principles and practical techniques needed to extract meaningful chemical information from Raman spectroscopic data.
Table of Contents
- 1. Introduction to Raman Spectroscopy Interpretation
- 2. Understanding What a Raman Spectrum Shows
- 3. Preparing for Spectrum Interpretation
- 4. Step-by-Step Interpretation Procedure
- 5. Identifying Functional Groups
- 6. Peak Assignment Strategies
- 7. Practical Case Studies
- 8. Common Pitfalls and How to Avoid Them
- 9. Summary
- 10. Advanced Materials Case Studies
- 11. Key Takeaways
- 12. References
1. Introduction to Raman Spectroscopy Interpretation
Raman spectroscopy is a powerful analytical technique that provides a molecular fingerprint of materials through the inelastic scattering of monochromatic light. Think of it as a conversation between light and molecules—when laser light interacts with a sample, the molecules respond by scattering the light at shifted frequencies that reveal their vibrational modes. Each vibration corresponds to specific molecular motions, creating a unique spectral signature that we can decode to understand molecular structure and composition [1]. If you're new to materials science, you might want to start with our Materials Science 101 tutorial for foundational concepts.
The challenge many students face is not collecting the spectrum—modern instruments make that relatively straightforward—but rather interpreting what the spectrum is telling you. A Raman spectrum may initially appear as a complex array of peaks at various positions and intensities, but with systematic analysis, it becomes a rich source of chemical information.
Mastering Raman spectrum interpretation allows you to:
- Identify unknown materials and verify their purity
- Detect molecular structure and bonding characteristics
- Monitor chemical reactions and phase transitions
- Characterize crystallinity and molecular orientation
- Analyze stress, strain, and defects in materials
In this lecture, we will develop a systematic framework for reading Raman spectra. Rather than memorizing thousands of peak positions, you will learn to think like a spectroscopist—recognizing patterns, applying chemical knowledge, and using reference resources effectively. For a comprehensive understanding of materials characterization, you may also want to explore our tutorial on X-ray diffraction analysis, which provides complementary structural information.
2. Understanding What a Raman Spectrum Shows
Before diving into interpretation, we must understand what information a Raman spectrum contains and what each component represents.
2.1 The Axes of a Raman Spectrum
A typical Raman spectrum is plotted with two axes:
- X-axis (Raman Shift): Measured in wavenumbers (cm-1), this represents the energy difference between incident and scattered photons. The Raman shift is independent of the excitation wavelength, making spectra comparable across different instruments [2].
- Y-axis (Intensity): Represents the number of scattered photons at each Raman shift. Intensity is proportional to the concentration of the vibrating species and the Raman scattering cross-section of that particular vibration.
2.2 What Peaks Represent
Each peak in a Raman spectrum corresponds to a specific vibrational mode of the molecule. Think of molecules as systems of balls (atoms) connected by springs (chemical bonds). When energy is applied, these systems vibrate in characteristic ways—stretching, bending, twisting, and rocking [3]. For interactive visualizations of molecular vibrations, ChemTube3D provides excellent educational animations.
Consider a Raman spectrum like a musical chord. Just as different instruments playing together create distinct frequencies that combine into a recognizable sound, different molecular vibrations create peaks at characteristic positions that combine into a unique molecular fingerprint. A trained musician can identify instruments in a chord; a trained spectroscopist can identify functional groups in a spectrum.
2.3 Peak Characteristics
When analyzing peaks, we examine four primary characteristics:
| Characteristic | What It Tells Us | Typical Range |
|---|---|---|
| Position | Type of vibration and chemical bonds involved | 200-3500 cm-1 |
| Intensity | Concentration and polarizability change | Arbitrary units |
| Width | Crystallinity, homogeneity, relaxation times | 5-50 cm-1 FWHM |
| Shape | Symmetry, overlapping peaks, interactions | Lorentzian, Gaussian, mixed |
2.4 Spectral Regions
The Raman spectrum is typically divided into regions based on the types of vibrations observed:
- Low-frequency region (50-500 cm-1): Lattice modes, heavy atom vibrations, skeletal bending
- Fingerprint region (500-1800 cm-1): Complex combination of C-C, C-N, C-O stretching and bending modes; unique to each molecule
- High-frequency region (1800-3500 cm-1): C=O, C=C, C≡C, N-H, O-H stretching modes
3. Preparing for Spectrum Interpretation
Successful interpretation begins before you even look at the spectrum. Proper preparation ensures you extract maximum information efficiently and accurately.
3.1 Gather Essential Information
Before interpretation, collect these details about your measurement:
- Sample information: Expected composition, phase, purity, preparation method
- Acquisition parameters: Laser wavelength, power, integration time, number of accumulations
- Instrument details: Spectral resolution, detector type, objective used
- Environmental conditions: Temperature, humidity, atmospheric exposure
The same peak position can have different meanings in different materials. For example, a peak at 520 cm-1 indicates crystalline silicon in semiconductors but could represent different vibrations in organic molecules. Always interpret peaks within the context of your sample type and expected chemistry.
3.2 Assemble Reference Materials
Professional spectroscopists rely on reference resources rather than memorizing peak positions. Build your reference library:
- Raman spectral databases (RRUFF, Spectral Database for Organic Compounds - SDBS)
- Correlation charts for functional group frequencies
- Published spectra from peer-reviewed literature
- Standard reference materials for your specific application
- Group theory and symmetry tables for crystalline materials
3.3 Perform Quality Checks
Before interpretation, verify your spectrum quality:
Check for fluorescence background, which appears as a sloping or curved baseline. Moderate fluorescence can be corrected; severe fluorescence may require sample preparation modifications.
Ensure your signal is significantly above the noise level. A good spectrum typically has S/N ratio greater than 10:1 for the main peaks.
Look for sharp, narrow peaks that appear randomly—these are cosmic ray artifacts and should be removed through spike filtering or multiple accumulations.
If using an internal standard or known peak, verify the peak appears at the expected position (within ±2 cm-1 for most instruments).
4. Step-by-Step Interpretation Procedure
Now we arrive at the core of this lecture: a systematic, reproducible method for interpreting any Raman spectrum. This procedure works whether you are analyzing a simple pure compound or a complex mixture.
Professional interpretation follows a structured workflow that minimizes errors and ensures consistent results. The procedure outlined below has been developed through decades of spectroscopic practice and represents industry best practices [4].
Step 1: Initial Overview
Goal: Get a general sense of the spectrum before detailed analysis.
Actions:
- View the entire spectral range (typically 100-3500 cm-1)
- Note the number of major peaks and their approximate positions
- Observe the overall intensity pattern—are peaks evenly distributed or concentrated in certain regions?
- Identify the most intense peak(s)—these often correspond to the most abundant or Raman-active species
Experienced spectroscopists spend the first 5 seconds just looking at the overall pattern before zooming into details. This prevents "missing the forest for the trees" and helps recognize familiar spectral signatures quickly.
Step 2: Identify Characteristic Strong Peaks
Goal: Locate the most intense and sharp peaks that serve as spectral landmarks.
Actions:
- List the 5-10 strongest peaks with their positions (±2 cm-1 precision)
- Estimate relative intensities (very strong, strong, medium, weak)
- Note any exceptionally sharp or broad peaks, as width carries information
- Check if any strong peaks fall in characteristic regions (e.g., 1600-1680 cm-1 for C=C)
Step 3: Systematic Region-by-Region Analysis
Goal: Methodically analyze each spectral region for specific chemical information.
Work through the spectrum from high to low wavenumber (or vice versa, but be consistent). For each region, ask:
High-Frequency Region (2500-3500 cm-1)
- Are there O-H or N-H stretches? (typically broad, 3200-3600 cm-1)
- Is there a C-H stretch region? (2800-3100 cm-1)
- Are the C-H stretches characteristic of sp³, sp², or sp hybridization?
Double Bond Region (1500-1800 cm-1)
- Is there a carbonyl (C=O) peak? (typically 1650-1750 cm-1)
- Are aromatic C=C stretches present? (1580-1620 cm-1)
- Are there C=N or N=O peaks?
Fingerprint Region (500-1500 cm-1)
- What is the overall complexity? (Simple patterns suggest simple molecules)
- Are there strong peaks indicating specific functional groups? (e.g., 1000-1200 cm-1 for C-O)
- Do you see characteristic patterns from known structures? (e.g., benzene ring breathing at ~1000 cm-1)
Low-Frequency Region (100-500 cm-1)
- Are there lattice modes indicating crystalline structure?
- Do heavy atoms or metal-ligand bonds contribute peaks here?
- Are there skeletal bending modes of large molecular frameworks?
Step 4: Cross-Reference with Known Spectra
Goal: Compare your spectrum against reference databases or literature.
Actions:
- Search spectral databases using your sample information and major peak positions
- Overlay reference spectra with your data for visual comparison
- Check that all major peaks in the reference appear in your spectrum (and vice versa)
- Investigate any discrepancies—they may indicate impurities, polymorphs, or measurement differences
Step 5: Assign Peaks to Specific Vibrations
Goal: Correlate each observed peak with a molecular vibration mode.
This step requires combining:
- Your knowledge of the sample's expected molecular structure
- Group frequency correlation charts
- Literature assignments for similar compounds
- Symmetry and selection rules (for crystalline or highly symmetric molecules)
Create a peak assignment table documenting your conclusions:
| Peak Position (cm-1) | Relative Intensity | Assignment | Reference |
|---|---|---|---|
| 2900 | Strong | C-H symmetric stretch | [5] |
| 1650 | Very Strong | C=C aromatic stretch | [5] |
| 1000 | Medium | Ring breathing mode | [6] |
Step 6: Evaluate Consistency and Confidence
Goal: Validate your interpretation and assess confidence level.
Questions to ask:
- Do all expected functional groups show their characteristic peaks?
- Can all major peaks be explained by the proposed structure?
- Are relative intensities consistent with literature or theoretical predictions?
- Have alternative explanations been considered and ruled out?
- What is your confidence level: high (>90%), moderate (70-90%), or tentative (<70%)?
5. Identifying Functional Groups
Functional groups are the building blocks of organic chemistry, and recognizing their characteristic Raman signatures is essential for molecular identification. Unlike infrared spectroscopy, Raman spectroscopy excels at detecting certain groups due to differences in selection rules [7].
5.1 Raman-Active Functional Groups
The following functional groups produce particularly strong and reliable Raman signals:
Carbon-Carbon Multiple Bonds
- Position: 1620-1680 cm-1 (conjugated: 1600-1620 cm-1)
- Intensity: Very strong (highly polarizable bond)
- Examples: Alkenes, aromatic rings, polyenes
- Note: Much stronger in Raman than in IR due to large polarizability change
- Position: 2100-2260 cm-1
- Intensity: Weak to medium (depends on symmetry)
- Examples: Alkynes, cyanide groups
- Note: Symmetric alkynes (R-C≡C-R) may be Raman inactive
Aromatic Systems
Aromatic rings produce distinctive patterns easily recognized with practice:
- Ring breathing mode: 990-1010 cm-1 (benzene: 992 cm-1)
- C=C stretches: 1580-1620 cm-1 (often appears as doublet)
- C-H in-plane bend: 1170-1185 cm-1
- C-H out-of-plane bend: 670-900 cm-1 (position indicates substitution pattern)
Nitrogen-Containing Groups
| Functional Group | Position (cm-1) | Intensity | Notes |
|---|---|---|---|
| C≡N (nitrile) | 2210-2260 | Medium-Strong | Sharp, distinctive peak |
| C=N (imine) | 1640-1690 | Medium | Can overlap with C=O |
| N=O (nitro) | 1340-1380, 1520-1560 | Strong | Two peaks: symmetric and asymmetric stretch |
| N-H (amine) | 3300-3500 | Weak | Often weak or absent in Raman |
Sulfur-Containing Groups
Sulfur compounds produce strong Raman signals, making Raman spectroscopy particularly valuable for studying these systems:
- S-S stretch: 500-540 cm-1 (very strong, diagnostic for disulfides)
- C-S stretch: 600-800 cm-1
- S=O stretch (sulfoxide): 1030-1070 cm-1
- SO₂ symmetric stretch (sulfone): 1140-1160 cm-1
5.2 Weaker but Important Groups
Some functional groups are weak Raman scatterers but still provide useful information:
The carbonyl group is generally weak in Raman spectroscopy (unlike in IR), but can still be observed:
- Ketones: 1705-1725 cm-1
- Aldehydes: 1720-1740 cm-1
- Esters: 1735-1750 cm-1
- Carboxylic acids: 1700-1720 cm-1
- Amides: 1630-1680 cm-1 (amide I band)
5.3 Complementarity with IR Spectroscopy
Understanding which functional groups are strong in Raman versus infrared helps you choose the right technique:
This complementarity arises from different selection rules. Raman scattering requires a change in polarizability during vibration, while IR absorption requires a change in dipole moment [8]. Symmetric vibrations are often Raman-active but IR-inactive, and vice versa. For a detailed comparison of these complementary techniques, see our comprehensive guide on FTIR spectroscopy. The Purdue University Chemistry Department also provides excellent resources on IR and Raman selection rules.
6. Peak Assignment Strategies
Assigning peaks to specific vibrational modes is both art and science. This section provides advanced strategies for making confident, defensible assignments.
6.1 The Multi-Source Approach
Never rely on a single source for peak assignment. Instead, triangulate information from multiple references:
Start with general correlation charts that list typical peak ranges for functional groups. These provide initial hypotheses about peak identities.
Use databases like RRUFF (for minerals), SDBS (for organics), or commercial libraries (Wiley, NIST Chemistry WebBook) to find spectra of identical or closely related compounds. For beginners, our spectroscopy fundamentals guide explains how to effectively search and compare spectral data.
Read papers on your specific compound or compound class. Published assignments have (ideally) been peer-reviewed and experimentally validated.
For simple molecules, DFT calculations can predict Raman frequencies and intensities. While not always quantitatively accurate, they help confirm assignments. MIT OpenCourseWare provides free educational materials on computational spectroscopy methods.
6.2 Using Isotopic Substitution
Isotopic substitution is a powerful technique for confirming peak assignments. When you replace an atom with its isotope (e.g., ¹H with ²H, or ¹²C with ¹³C), the peak position shifts predictably:
If a peak shifts upon deuteration, you know hydrogen atoms participate in that vibration. If it does not shift, hydrogen is not significantly involved.
6.3 Temperature and Pressure Variations
Systematic variation of measurement conditions can provide assignment clues:
- Temperature effects: Intermolecular vibrations (lattice modes, hydrogen bonds) shift more dramatically with temperature than intramolecular modes
- Pressure effects: Compression generally shifts peaks to higher frequencies and can reveal phase transitions
- Solvent effects: Comparing spectra in different solvents helps distinguish surface-sensitive modes from bulk vibrations
6.4 Polarization Analysis
Raman scattering can be polarized or depolarized depending on the symmetry of the vibration. Measuring the depolarization ratio helps assign vibrational symmetry:
ρ = I⊥ / I∥
where I⊥ and I∥ are intensities with perpendicular and parallel polarization
- ρ < 0.75: Polarized (totally symmetric vibrations)
- ρ = 0.75: Depolarized (non-totally symmetric vibrations)
This technique is particularly useful for crystalline materials and symmetric molecules where symmetry classification aids assignment [9].
6.5 Handling Overlapping Peaks
When peaks overlap, you may need to deconvolute them to assign individual components:
- Peak fitting: Use Lorentzian, Gaussian, or Voigt functions to mathematically separate overlapping peaks
- Second derivative spectroscopy: Calculate the second derivative to enhance resolution and reveal hidden shoulders
- Curve resolution algorithms: Apply techniques like MCR-ALS (Multivariate Curve Resolution - Alternating Least Squares) for complex mixtures
Peak fitting is a mathematical procedure that can fit almost any shape if you use enough peaks. Always validate your fit with:
- Physical reasonableness (are the fitted peak positions chemically meaningful?)
- Minimal number of peaks (Occam's razor—simpler is better)
- Consistency across replicate measurements
- Support from independent evidence (literature, calculations, etc.)
7. Practical Case Studies
Let us apply our systematic approach to real-world examples. These case studies illustrate how the interpretation procedure works in practice.
Case Study 1: Identifying a Simple Organic Compound
Scenario: You have a clear liquid sample suspected to be an aromatic compound. The Raman spectrum shows the following major peaks:
| Peak Position (cm-1) | Relative Intensity | Width |
|---|---|---|
| 3065 | Medium | Narrow |
| 1602 | Very Strong | Narrow |
| 1586 | Strong | Narrow |
| 1178 | Medium | Narrow |
| 992 | Very Strong | Sharp |
| 615 | Medium | Narrow |
Step-by-step interpretation:
- Overview: Six main peaks spanning from 615 to 3065 cm-1. All peaks are narrow, suggesting a pure, low-molecular-weight compound.
- Region analysis:
- 3065 cm-1: C-H stretch in the aromatic region
- 1602, 1586 cm-1: Aromatic C=C stretches (characteristic doublet)
- 1178 cm-1: C-H in-plane bending
- 992 cm-1: Ring breathing mode (very diagnostic)
- 615 cm-1: Ring deformation
- Pattern recognition: The strong peak at 992 cm-1 is characteristic of benzene and simple benzene derivatives.
- Database comparison: Searching for aromatic compounds with a 992 cm-1 breathing mode suggests benzene (C₆H₆) or monosubstituted benzenes.
- Conclusion: The spectrum is consistent with benzene. The absence of additional peaks rules out substituted benzenes.
Case Study 2: Characterizing a Carbon Material
Scenario: You synthesized a carbon material and need to assess its graphitic quality. The spectrum shows:
| Peak Position (cm-1) | Relative Intensity | FWHM (cm-1) |
|---|---|---|
| 1350 | Medium | 85 |
| 1580 | Very Strong | 45 |
| 2700 | Strong | 60 |
Interpretation for carbon materials:
- D band (1350 cm-1): Disorder-induced band, activated by structural defects, edges, or sp³ carbon
- G band (1580 cm-1): Graphitic band from in-plane C=C stretching of sp² carbons
- 2D band (2700 cm-1): Second-order two-phonon process, sensitive to stacking and layer number
The quality of graphitic materials is often assessed using the intensity ratio I_D/I_G:
Additional information from peak width:
- Narrow G band (FWHM = 45 cm-1) indicates relatively ordered graphitic domains
- Broad D band (FWHM = 85 cm-1) suggests heterogeneous defect environment
Conclusion: The material is partially graphitized carbon with moderate disorder. The presence of the 2D band confirms sp² character, but the significant D band indicates defects or small crystallite size. For more on characterizing carbon nanomaterials, explore our guide on carbon nanomaterials and graphene analysis.
Case Study 3: Mixture Analysis
Scenario: You suspect your sample is a mixture of two components. The spectrum is complex with many peaks, some of which do not match any single compound in your database.
Strategy for mixtures:
Look for peaks that are unique to each component. These serve as "marker peaks" for quantification.
If you know one component, subtract its reference spectrum (with intensity scaling) to reveal the second component. Alternatively, use linear combination fitting.
Confirm mixture composition using complementary methods like chromatography, mass spectrometry, or NMR.
For complex mixtures, chemometric methods like Principal Component Analysis (PCA) or Partial Least Squares (PLS) can decompose overlapping spectra into pure component spectra and concentrations [10]. These require multiple samples with varying compositions.
8. Common Pitfalls and How to Avoid Them
Even experienced spectroscopists encounter challenges. Being aware of common pitfalls helps you avoid errors and improves your interpretation reliability.
Pitfall 1: Over-Reliance on Peak Position Alone
Different vibrations can occur at similar frequencies. For example, aromatic C=C stretch (~1600 cm-1) overlaps with C=N stretch and amide I band regions.
Solution: Always consider multiple peak characteristics (position, intensity, width, shape) and the overall spectral pattern. Context is critical—a peak at 1600 cm-1 in a nitrogen-free aromatic is certainly C=C, but in a protein sample, it is likely amide I.
Pitfall 2: Ignoring Baseline and Background
Fluorescence background, sloping baselines, or inadequate background subtraction can distort peak intensities and positions, leading to incorrect assignments or missed weak peaks.
Solution:
- Apply appropriate baseline correction (polynomial fitting, asymmetric least squares)
- For fluorescent samples, try longer wavelength lasers (785 nm, 1064 nm) or photobleaching
- Always measure and subtract dark current and cosmic ray backgrounds
Pitfall 3: Sample Damage from Laser Heating
High laser power can heat or chemically alter the sample, creating artifacts or degradation products. Common signs include: peak shifts during measurement, appearance of new peaks over time, or sample discoloration.
Solution:
- Start with low laser power and increase only if signal is insufficient
- Compare spectra at different powers to verify consistency
- For sensitive samples, use sample rotation, rapid scanning, or longer wavelengths
- Monitor the sample visually during acquisition for signs of damage
Pitfall 4: Misidentifying Instrumental Artifacts
Instrumental artifacts can masquerade as sample peaks:
| Artifact Type | Characteristics | How to Identify |
|---|---|---|
| Cosmic ray spikes | Very sharp, narrow, random positions | Disappear with multiple accumulations |
| Laser plasma lines | Sharp peaks at fixed positions | Present even without sample |
| Rayleigh scattering | Very intense peak at 0 cm-1 | Blocked by notch/edge filter |
| Substrate signals | Peaks from glass, silicon, or mounting material | Measure substrate alone to identify |
Pitfall 5: Insufficient Reference Verification
Not all published peak assignments are correct. Errors propagate through literature when authors cite earlier papers without verification.
Solution:
- Verify assignments from multiple independent sources
- Prioritize well-cited, peer-reviewed papers from reputable journals
- Check if authors provide experimental evidence (isotope shifts, calculations) supporting their assignments
- When possible, measure your own reference standards
Pitfall 6: Neglecting Polarization and Orientation Effects
Crystals, fibers, and oriented samples can show dramatically different spectra depending on laser polarization and sample orientation. Relative intensities may not match reference spectra from powder or solution samples.
Solution:
- For single crystals, record spectra at multiple orientations
- For fibers or films, vary polarization or use depolarized measurements
- Compare with powder or solution references when available
- Document orientation and polarization conditions in your notes
Pitfall 7: Overinterpreting Weak Features
Features barely above noise level may be random fluctuations rather than real peaks. Assigning significance to noise leads to incorrect conclusions.
Solution:
- Establish a signal-to-noise threshold (typically S/N > 3 for detection, >10 for quantification)
- Replicate measurements to verify reproducibility of weak features
- Use statistical tests to distinguish signal from noise
- Be honest about uncertainty—report weak features as tentative
9. Summary
Interpreting Raman spectra is a systematic, learnable skill that combines spectroscopic knowledge, chemical intuition, and methodical analysis. Throughout this lecture, we have built a comprehensive framework for extracting chemical information from Raman data.
The key principles to remember are:
- Be systematic: Follow a reproducible procedure for every spectrum—initial overview, characteristic peak identification, region-by-region analysis, reference comparison, peak assignment, and validation.
- Use context: Peak assignments must make chemical sense given your sample type, preparation history, and expected composition.
- Verify with multiple sources: Correlation charts, databases, literature, and when possible, computational predictions or experimental variations.
- Document thoroughly: Record not just peak positions, but also intensities, widths, measurement conditions, and your reasoning for assignments.
- Acknowledge limitations: Be honest about confidence levels and report tentative assignments as such.
As you gain experience, pattern recognition becomes faster and more intuitive. You will develop a mental library of common spectral signatures—the aromatic ring breathing mode at ~1000 cm-1, the sulfide S-S stretch at ~500 cm-1, the graphitic G band at 1580 cm-1—that allow rapid preliminary interpretation. However, even experts follow systematic procedures for complex or unfamiliar samples.
Remember that Raman spectroscopy is often most powerful when combined with complementary techniques. Infrared spectroscopy reveals groups Raman cannot see; X-ray diffraction provides structural information; mass spectrometry gives molecular weight; NMR reveals connectivity. Use each technique for its strengths and cross-validate results. For a complete overview of analytical techniques in materials science, see our comprehensive guide on materials characterization methods.
10. Advanced Materials Case Studies
Building on the foundational interpretation skills we have developed, let us now examine two advanced case studies from cutting-edge materials research. These examples demonstrate how Raman spectroscopy reveals structural transformations in complex functional materials—from lead-free ferroelectric ceramics to flexible polymer films.
Case Study 4: Raman Analysis of Rare-Earth Doped BNT Ceramics (Lead-Free System)
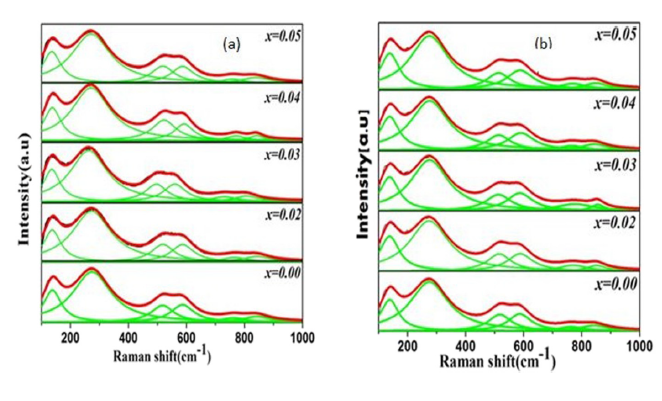
Figure 1: Raman spectra of rare-earth doped BNT ceramics at varying concentrations (x = 0.00 to 0.05). Red lines represent experimental data; green lines show Lorentzian peak fits revealing structural phase evolution.[Verma et al. J.of Applied Physics, 2019]
Bismuth Sodium Titanate (BNT) is an important lead-free ferroelectric material that serves as an environmentally friendly alternative to lead-based piezoelectrics. Researchers often dope BNT with rare-earth ions like La³⁺ (donor) and Sc³⁺ (acceptor) to tune its ferroelectric, piezoelectric, and dielectric properties. For more background on ferroelectric materials and their applications, see our detailed tutorial on ferroelectric ceramics and their properties.
The spectra shown above display BNT doped at different concentrations (x = 0.00 to 0.05) for both La³⁺ and Sc³⁺ systems. The red line represents experimental data collected from ceramic samples; green lines are Lorentzian peak fits used to deconvolute overlapping vibrational modes.
Key Raman Active Modes Observed (100–1000 cm-1)
| Peak Position (cm-1) | Assignment | Structural Information |
|---|---|---|
| ~135–138 | Bi³⁺/Na⁺ vibrations | A-site cation motion in [BiO₆]/[NaO₆] clusters |
| ~270–275 | Ti–O bending/stretching | TiO₆ octahedral deformation modes |
| ~450–700 (broad) | O octahedral vibrations | Most sensitive to structural phase changes |
| ~700 | A₁g + Eg modes | Overlapping longitudinal optical modes |
What Happens with Increasing Doping?
As the doping concentration increases from x = 0.00 to x = 0.05, several critical spectroscopic changes occur:
- Red Shift: Many peaks, especially in the 270–700 cm-1 region, shift systematically to lower wavenumbers. This occurs because La³⁺ and Sc³⁺ substitution at A-sites distorts the surrounding TiO₆ octahedra, making some Ti-O bonds longer and consequently weaker. Weaker bonds vibrate at lower frequencies.
- Intensity Modulation: Peak intensity first increases up to x = 0.03, indicating improved crystallinity and long-range order. However, at higher doping levels (x > 0.03), intensity decreases due to increased structural disorder and possible defect formation.
- Peak Separation: The initially broad band in the 450–700 cm-1 region splits into two more clearly resolved peaks. These peaks move progressively farther apart with increasing dopant concentration, indicating that the oxygen octahedral environment is becoming less symmetric.
Why does doping cause these changes? La³⁺ (ionic radius ~1.16 Å) and Sc³⁺ (ionic radius ~0.75 Å) have different sizes compared to the native Bi³⁺ (~1.03 Å) and Na⁺ (~1.02 Å) ions they replace. This size mismatch introduces local strain in the crystal lattice, tilting and distorting the corner-sharing TiO₆ octahedra that form the perovskite framework. As more dopant ions are incorporated, the cumulative strain drives a structural phase transition.
Phase Evolution: From Rhombohedral to Pseudocubic
The most significant finding from this Raman analysis is the structural phase evolution. Pure BNT (x = 0.00) exhibits a rhombohedral crystal structure at room temperature, characterized by specific symmetry-allowed vibrational modes. With increasing La³⁺ or Sc³⁺ doping, the structure gradually transforms toward a pseudocubic phase.
This phase evolution is beautifully captured by:
- The systematic red shift of octahedral vibration modes
- The increasing separation of fitted peaks in the oxygen octahedral vibration region (450–700 cm-1)
- Changes in relative peak intensities reflecting altered selection rules as symmetry changes
Case Study 5: Raman Analysis of Ferroelectric Polymer – P(VDF-HFP) Copolymer Thin Film
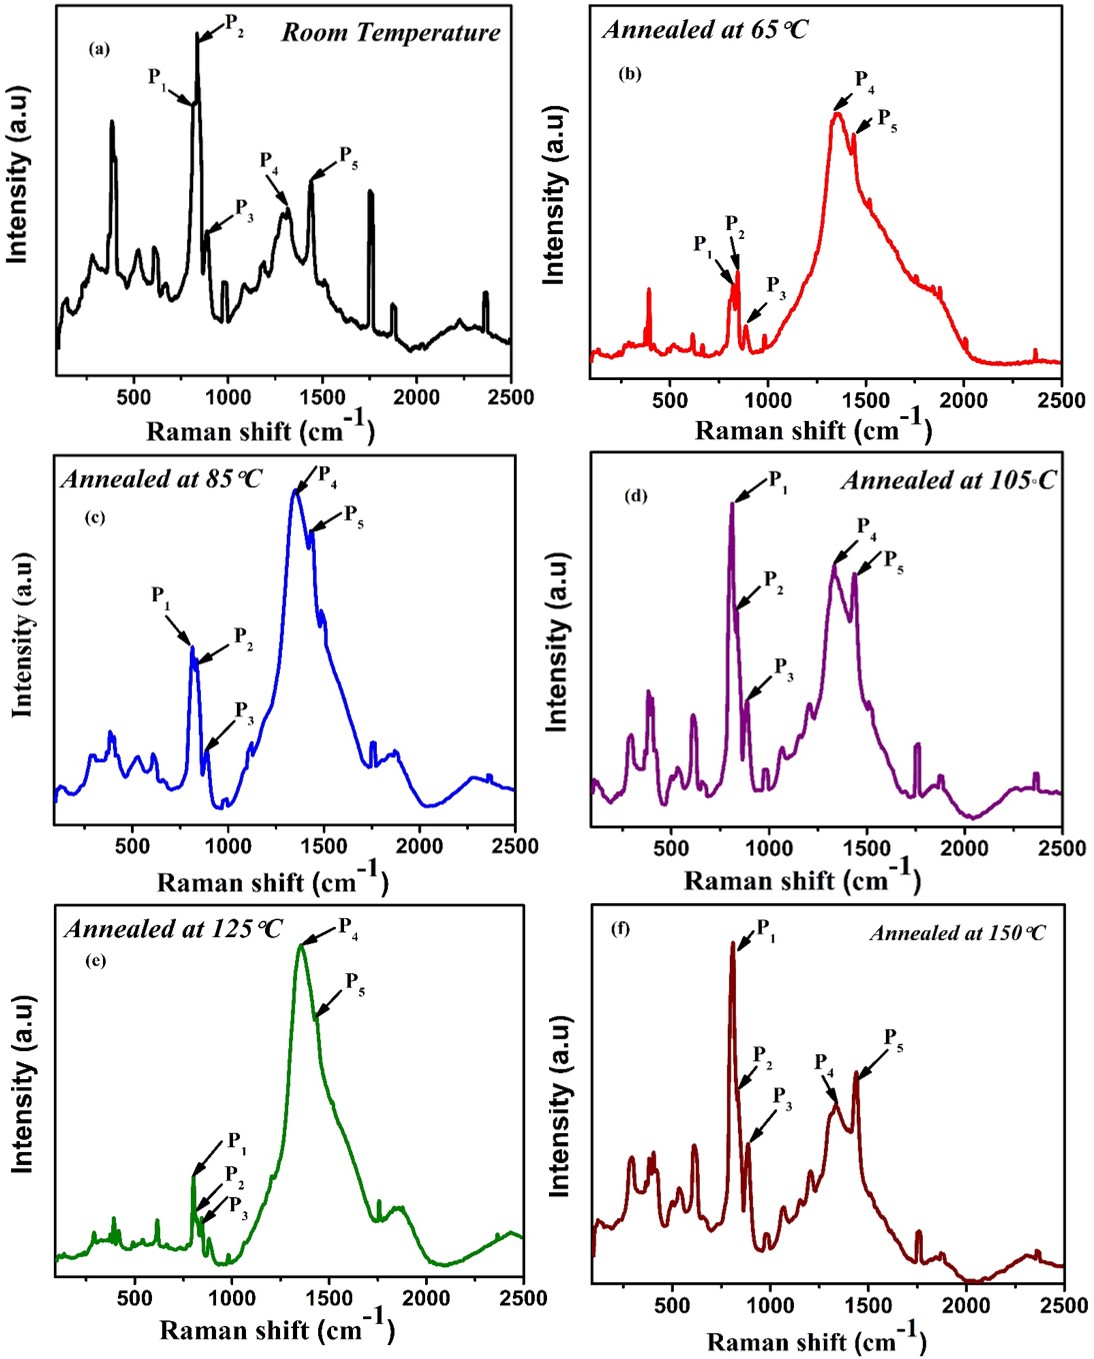
Figure 2: Raman spectra of P(VDF-HFP) thin films annealed at temperatures from RT to 150°C. The 840 cm-1 ferroelectric β-phase peak progressively disappears with thermal treatment, indicating phase transformation.[Verma et al. J.of Applied Physics, 2019]
Now let us study a completely different class of functional materials—ferroelectric polymers. P(VDF-HFP) [Poly(vinylidene fluoride-co-hexafluoropropylene)] is a flexible, lightweight copolymer widely used in flexible electronics, piezoelectric sensors, energy harvesters, and wearable devices. Unlike rigid ceramic ferroelectrics, polymer ferroelectrics can be processed into thin, bendable films. For comprehensive coverage of polymer characterization methods, refer to our tutorial on advanced polymer characterization techniques.
The Raman spectra were recorded on P(VDF-HFP) thin films annealed at progressively higher temperatures: room temperature (RT), 65°C, 85°C, 105°C, 125°C, and 150°C. The goal was to understand how thermal processing affects the polymer's ferroelectric phase composition.
Major Raman Peaks and Their Molecular Meaning
| Peak Label | Position (cm-1) | Assignment | Phase Association |
|---|---|---|---|
| P₁ | 790–825 | CH₂ rocking + CF₂ stretching | Paraelectric α-phase crystals |
| P₂ | ~840 | CH₂ rocking + CF₂ symmetric stretch | Ferroelectric β-phase (all-trans) |
| P₃ | 887–895 | C–H bond rocking vibrations | Both phases |
| P₄ | ~1350 | C–C stretching (sp³ hybridized) | Polymer backbone |
| P₅ | ~1450 | C–C stretching (sp² character) | Shoulder indicating unsaturation |
Critical Observation: Thermal Destruction of the Ferroelectric Phase
The most important observation in these spectra is the behavior of peak P₂ at 840 cm-1, which is the signature vibration of the ferroelectric β-phase. In this phase, the polymer chains adopt an all-trans planar zigzag conformation (TTTT...), creating aligned dipole moments that give rise to spontaneous polarization and piezoelectric response.
At room temperature and moderate annealing temperatures (up to ~85°C), the 840 cm-1 β-phase peak is clearly present and relatively strong. However, when the film is annealed at 105°C and above, dramatic changes occur:
- The 840 cm-1 peak shifts to slightly lower frequency
- Its intensity drops dramatically, nearly disappearing at 150°C
- Simultaneously, the 790–825 cm-1 α-phase peak grows stronger
This spectroscopic evidence indicates loss of the ferroelectric β-phase. The polymer undergoes a thermally-induced phase transformation from the polar, ferroelectric β-phase into the more thermodynamically stable, non-polar α-phase (which has a TGTG' helical conformation with no net dipole moment).
Think of polymer chains as long strands of spaghetti. In the ferroelectric β-phase, the spaghetti is straight, aligned, and rigid (all-trans conformation)—this creates the organized structure needed for ferroelectricity. When you heat the polymer above a critical temperature, thermal energy makes the spaghetti strands curl, twist, and relax into a more comfortable coiled state (α-phase helical conformation). Raman spectroscopy acts as our molecular-scale eyes, showing us exactly when this relaxation occurs by tracking the disappearance of the 840 cm-1 "straight spaghetti" signal.
Additional Spectroscopic Details
Beyond the critical β-to-α phase transition, several other features provide complementary information:
- Bands at 977–986 cm-1 and 1069–1075 cm-1: CH₂ wagging and out-of-plane C–H bonding modes. These show minor shifts with annealing, reflecting changes in local molecular environment.
- Broad band ~500 cm-1: Presence of amorphous regions. The breadth and position of this feature indicate the degree of crystallinity versus amorphous content in the polymer film.
- Red shift across multiple peaks: Higher annealing temperature causes systematic red shifts in several peaks. This occurs because thermal expansion and increased chain mobility weaken covalent bonds (C–F, C–H, C–C), reducing their force constants and vibrational frequencies.
Effect of Thermal Treatment on Crystallinity and Phase Composition
The evolution of the Raman spectra reveals a complex thermal processing window:
- Low temperature (RT to ~85°C): β-phase is stable, crystallinity may actually improve slightly due to enhanced molecular mobility allowing better chain packing
- Critical transition (~105°C): Onset of β-to-α transformation. The β-phase begins to convert to the more stable α-phase
- High temperature (125°C to 150°C): Nearly complete conversion to α-phase. The ferroelectric properties are lost, though overall crystallinity may remain high
These Raman findings perfectly match X-ray diffraction (XRD) patterns from the same samples. XRD shows that the characteristic β-phase diffraction peaks (2θ ≈ 20.6°) disappear at higher annealing temperatures, while α-phase peaks (2θ ≈ 18.3° and 19.9°) grow stronger. The combination of Raman and XRD provides complementary molecular-scale and long-range crystallographic views of the same phase transformation.
Comparative Analysis: Ceramics vs Polymers
Comparing these two case studies reveals fundamental differences in how inorganic ceramics and organic polymers respond to chemical and thermal perturbations:
| Aspect | BNT Ceramics (Case Study 4) | P(VDF-HFP) Polymer (Case Study 5) |
|---|---|---|
| Perturbation Type | Chemical doping (La³⁺, Sc³⁺) | Thermal annealing |
| Raman Signature | Red shift + peak splitting | Phase-specific peak disappearance |
| Physical Mechanism | Lattice strain → octahedral distortion | Chain relaxation → conformational change |
| Phase Transition | Rhombohedral → Pseudocubic | β-phase (all-trans) → α-phase (helical) |
| Reversibility | Irreversible (doping is permanent) | Partially reversible (can be re-poled) |
Both case studies demonstrate Raman spectroscopy's power to reveal structure-property relationships in functional materials. Whether tracking dopant-induced symmetry changes in crystalline ceramics or monitoring thermal phase transitions in flexible polymers, Raman provides the molecular-scale insights needed to optimize material performance for next-generation electronic devices.
11. Key Takeaways
12. References
- D. A. Long, "The Raman Effect: A Unified Treatment of the Theory of Raman Scattering by Molecules," John Wiley & Sons, 2002.
- J. R. Ferraro, K. Nakamoto, and C. W. Brown, "Introductory Raman Spectroscopy," 2nd ed., Academic Press, 2003.
- P. Larkin, "Infrared and Raman Spectroscopy: Principles and Spectral Interpretation," Elsevier, 2011.
- I. R. Lewis and H. G. M. Edwards, "Handbook of Raman Spectroscopy: From the Research Laboratory to the Process Line," Marcel Dekker, 2001.
- G. Socrates, "Infrared and Raman Characteristic Group Frequencies: Tables and Charts," 3rd ed., John Wiley & Sons, 2001.
- D. Lin-Vien, N. B. Colthup, W. G. Fateley, and J. G. Grasselli, "The Handbook of Infrared and Raman Characteristic Frequencies of Organic Molecules," Academic Press, 1991.
- M. S. Dresselhaus, G. Dresselhaus, R. Saito, and A. Jorio, "Raman spectroscopy of carbon nanotubes," Physics Reports, vol. 409, no. 2, pp. 47-99, 2005.
- E. Smith and G. Dent, "Modern Raman Spectroscopy: A Practical Approach," John Wiley & Sons, 2005.
- D. A. McCreery, "Raman Spectroscopy for Chemical Analysis," John Wiley & Sons, 2000.
- K. L. A. Chan and S. G. Kazarian, "New opportunities in micro- and macro-attenuated total reflection infrared spectroscopic imaging: spatial resolution and sampling versatility," Applied Spectroscopy, vol. 57, no. 4, pp. 381-389, 2003.
- R. Verma and S. K. Rout, "Influence of annealing temperature on the existence of polar domain in uniaxially stretched polyvinylidene-co-hexafluoropropylene for energy harvesting applications," J. Appl. Phys., vol. 128, no. 23, Art. no. 234104, Dec. 2020, doi: 10.1063/5.0022463. [Author's peer-reviewed research involving crystal structure analysis and phase identification in ferroelectric polymer systems]
- R. Verma and S. K. Rout, "Frequency-dependent ferro–antiferro phase transition and internal bias field influenced piezoelectric response of donor and acceptor doped bismuth sodium titanate ceramics," J. Appl. Phys., vol. 126, no. 9, Art. no. 094103, Sep. 2019, doi: 10.1063/1.5111505. [Author's peer-reviewed research on crystal structure and phase analysis in perovskite materials, demonstrating the structural analysis methods discussed in this tutorial]
